> For the complete documentation index, see [llms.txt](https://docs.openalgo.in/llms.txt). Markdown versions of documentation pages are available by appending `.md` to page URLs; this page is available as [Markdown](https://docs.openalgo.in/new-features/pnl-tracker.md).
# PNL Tracker
### Overview
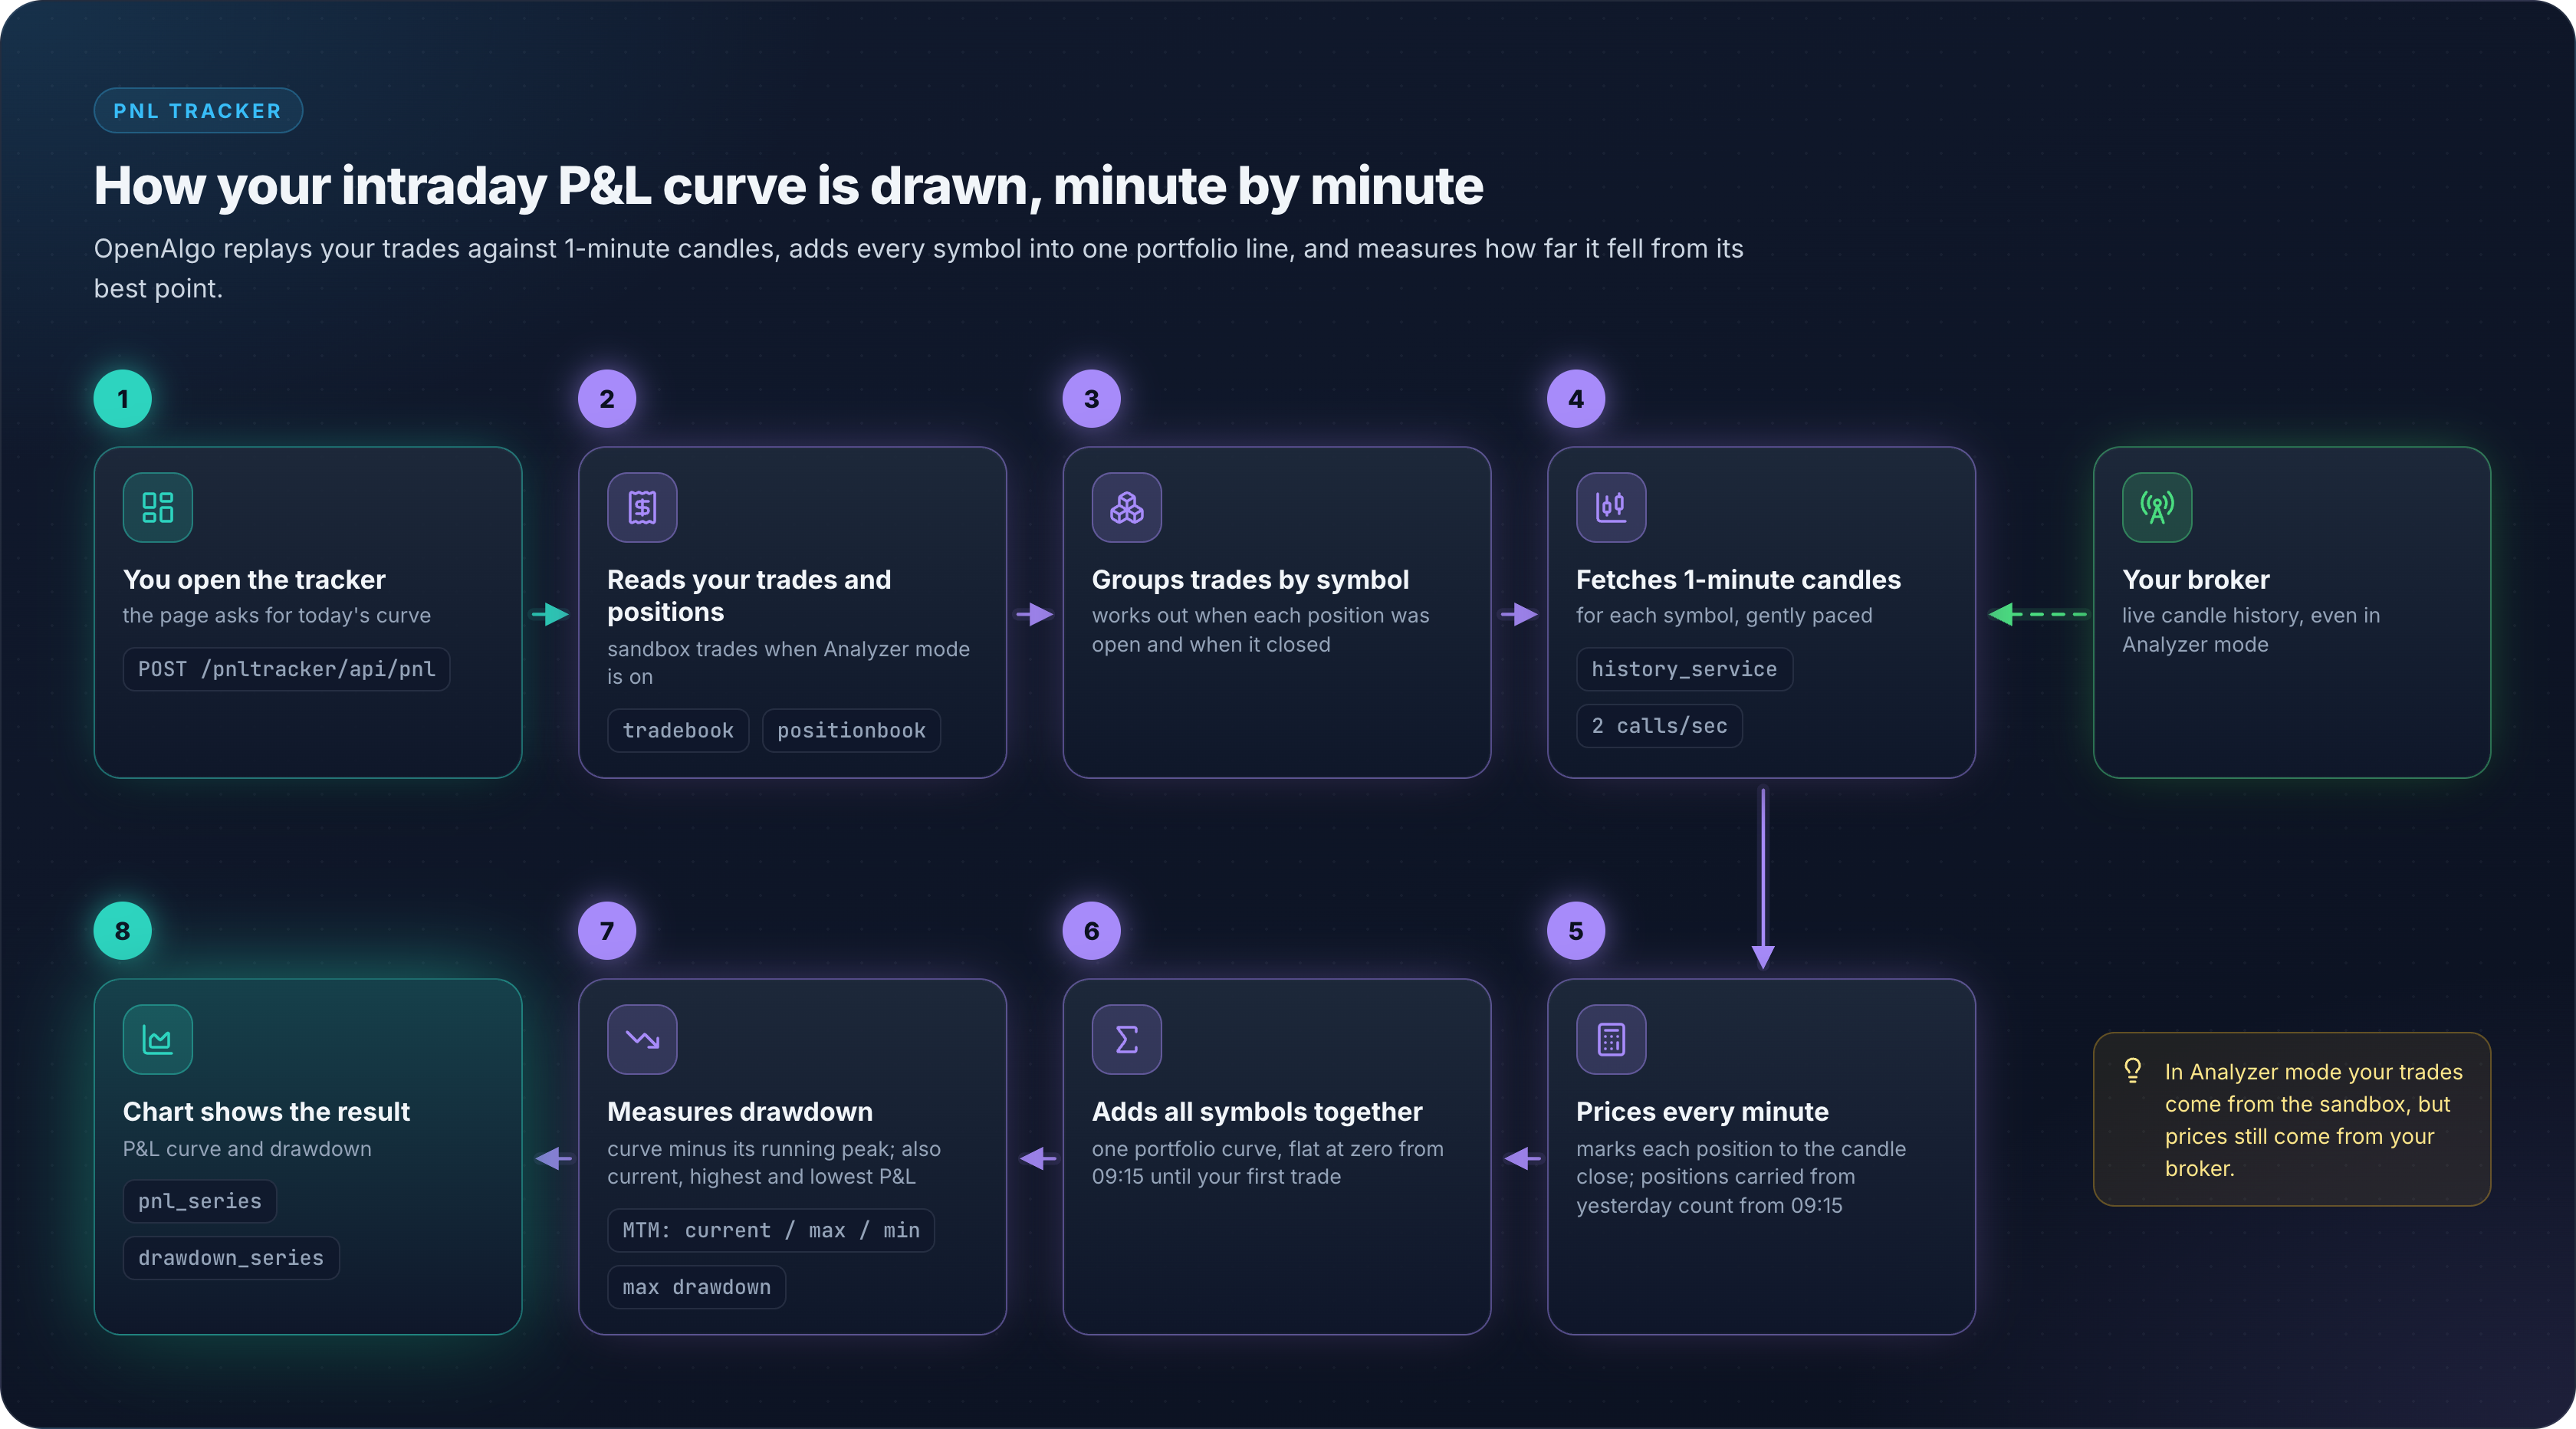
The PnL Tracker is a real-time intraday profit and loss view. It reconstructs a mark-to-market curve for the session from your tradebook and open positions, and plots it alongside a drawdown curve.
Open it at `/pnl-tracker`, or from the profile menu in the navigation bar.
### Metrics
Four figures are shown above the chart:
* **Current MTM**: mark-to-market profit or loss right now.
* **Max MTM**: the highest point reached during the session, with its timestamp.
* **Min MTM**: the lowest point reached during the session, with its timestamp.
* **Max Drawdown**: the largest peak-to-trough decline in the curve.
Currency formatting follows the connected broker, so a crypto account is not forced into rupee formatting.
### The Chart
Two Baseline series are drawn in **separate panes**, split three to one in favour of the PnL curve. Drawdown is always at or below zero and usually an order of magnitude smaller than MTM, so overlaying the two on one price scale flattened both.
| Series | Pane | Colour |
| ------------------------- | --------------- | ------ |
| MTM PnL, above break-even | Upper (3 parts) | Green |
| MTM PnL, below break-even | Upper (3 parts) | Red |
| Drawdown from peak | Lower (1 part) | Amber |
The chart is built on TradingView Lightweight Charts v5 and follows the application theme, so it redraws when you switch between light and dark.
A camera control captures the metrics and the chart together as a single image for sharing or journalling.
### How the Curve Is Built
For an executed trade:
```python
if action == 'BUY':
pnl = (current_price - executed_price) * quantity
else: # SELL
pnl = (executed_price - current_price) * quantity
```
When the tradebook is empty but positions exist, the position's average price is used instead:
```python
if quantity > 0: # long
pnl = (current_price - average_price) * quantity
else: # short
pnl = (average_price - current_price) * abs(quantity)
```
Per-symbol series are time-aligned with a pandas join and forward-filled so a symbol with no tick in a given minute does not punch a hole in the portfolio curve.
### Time Handling
* The window runs from **09:00 IST** to the current time, at 1-minute resolution.
* Broker timestamps arrive in several shapes: epoch seconds, epoch milliseconds, and ISO strings. All three are detected and converted to `Asia/Kolkata`.
* Historical fetches are paced by an internal rate limiter, because reconstructing a session for many symbols means one history call per symbol.
### Refresh Behaviour
There is **no auto-refresh**. Reconstructing the curve costs one tradebook call, one position-book call, and one history call per symbol, so refreshing on a timer would burn the broker's rate budget for little benefit. Use the Refresh control when you want an updated picture.
### Analyzer Mode
The tracker reads through the same tradebook and position-book services as the rest of OpenAlgo, so in Analyzer mode it plots sandbox trades and sandbox positions. There is a separate sandbox P\&L view at `/sandbox/mypnl` for sandbox-specific reporting.
### Broker Compatibility
The tracker needs two things from the active broker: a tradebook API and 1-minute historical data. Where either is missing or incomplete, the curve degrades rather than failing:
| Situation | Behaviour |
| ------------------------------------ | ---------------------------------------------- |
| No trades today | Positions alone are used, if any exist |
| No trades and no positions | Zero metrics, flat chart |
| Missing historical data for a symbol | Flat line at the current value for that symbol |
| Unparseable timestamp | Falls back to the default time range |
| Numeric field arrives as a string | Converted to float |
MCX and other lot-based commodity contracts get a special quantity path where the broker reports trade value equal to average price, which means one lot.
### Troubleshooting
| Symptom | Check |
| --------------------------------- | --------------------------------------------------------------------------------------------------------------------------------- |
| "No data in TradeBook" | Normal before your first fill. Position P\&L still plots if you hold something. |
| All zeros | Confirm an API key is configured at `/apikey`, that the market has been open since 09:00 IST, and that trades or positions exist. |
| Chart empty but metrics populated | The broker returned no 1-minute history for those symbols. Check the history API for one of them directly. |
| Wrong times on the axis | Conversion to IST is automatic; if it persists, the broker's timestamp format is the thing to report. |
| Screenshot fails | The capture runs in the browser. Check the browser console. |